Recently, we wrote about how Emission Control Areas (ECA) are one of two major drivers in adopting LNG as a marine fuel. The other driver being the price differential between LNG and diesel fuel. Looking at the number and the location of both planned and operational LNG vessels across the globe can help paint a picture of the regional drivers for LNG adoption as a marine fuel.
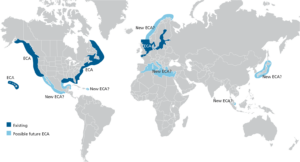
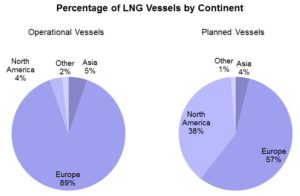
ECA have driven adoption of LNG vessels in Europe: LNG burns much cleaner than diesel or heavy fuel oil and enables vessels to satisfy ECA standards. Today, Europe is home to almost 90% of the world’s LNG powered vessels. One explanation for this is the designation of Europe’s northern coast as an ECA. Unlike the ECA around the United States, the ECA in northern Europe covers many vessels’ entire voyages. For example, any shipments from Germany to the United Kingdom or shipments from Norway across the North Sea are completely covered by an ECA. This would require the use of ultra-low sulfur diesel or scrubbers for the entire voyage. Conversely, a vessel traveling from China to California would only have a very small portion of its voyage covered by an ECA, allowing for the use of higher sulfur diesel and no scrubbers until it was close to the Californian coast. Exhibit 1 is a map of ECAs across the globe. Note that the ECAs in northern Europe covers almost all of the North and Baltic Seas.
Low natural gas prices in combination with ECA are driving LNG adoption in North America: Recently, the North American shale gas boom has caused a large amount of cheap natural gas to become available for companies to monetize and one option is through the use of LNG as a marine fuel. LNG marine vessels are seldom used in North America today. However, almost 40% of LNG fueled vessels on order are planned to be used in North America. Increased demand for LNG fueled vessels in North America can be attributed partly to ECAs around the coasts such as in Europe and partly to the price differential between LNG and diesel fuel. This could possibly be one explanation as to why North American has been slower to adopt LNG as a marine fuel in comparison to Europe. Exhibit 2 shows the percentage of LNG vessels by continent that are operational and those that are planned.
While LNG for marine has two main drivers, the relative contribution of each driver varies by region. ADI Analytics has further explored these drivers in its Natural Gas Monetization Research Service, which explores all end-uses for natural gas and their main drivers across regional markets. A copy of the prospectus is available here.
-Tyler Wilson and Uday Turaga


